The latest T-4 GB capacity market auction results cleared at £8.40/kW – less than half the clearing price of the three previous T-4 auctions, and lower than the expectations of many market analysts. A closer look at the auction results may reflect expectations for higher revenues from other market mechanisms like cash-out and, to a lesser extent, balancing services.
To understand the drivers of the lower clearing price, let’s first look at some of the changes in this year’s auction.
Reduced target capacity
The target capacity for the T-4 Capacity Market Auction for 2021/2022 was 49.2 GW, 2.5 GW lower than the target capacity for the 2020/2021 auction. With 54.9 GW of existing capacity pre-qualifying1 for the auction, existing capacity alone exceeded the target for the 2021/2022 auction by 12%. Existing capacity was only 3% above the target capacity for the 2020/2021 auction. A lower target capacity would have exerted downward pressure on clearing prices, everything else equal.
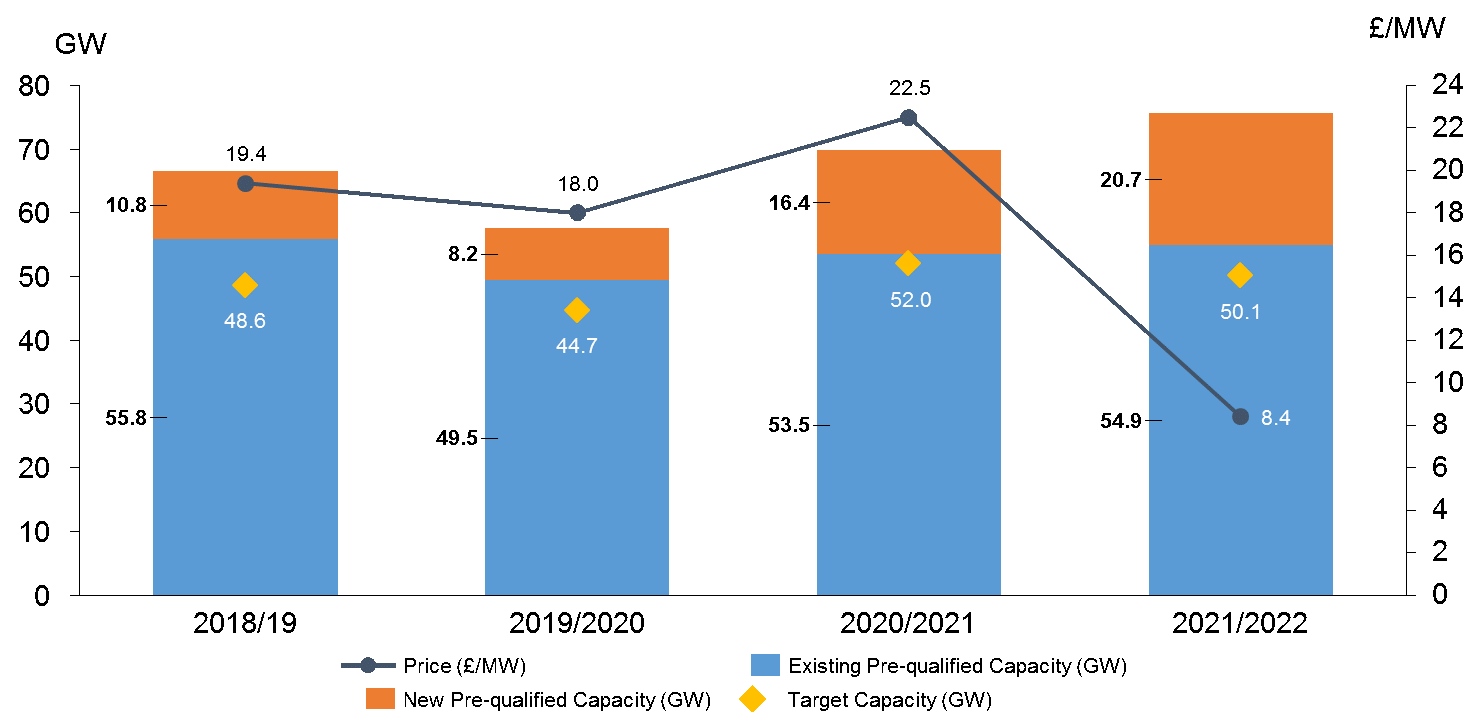
Figure 1: Historical T-4 Auction clearing price and target capacity2
Batteries
Even though there was a lot of focus on the participation of batteries in the capacity market auction, of the 1.3GW (3.3GW connection capacity) of battery projects that prequalified for the auction, only around 150MW were successful. This result follows from the change in battery derating announced late last year and reflects the challenging economics of battery projects, which need to stack revenues across a number of different markets in order to be economically viable. With the capacity market providing the only long-term revenue contract in the GB market, significant capacity market revenues are still critical to the financeability of battery projects.
Interconnectors
Interconnectors, the participation of which is already controversial,3 secured contracts for 4.56 GW, compared to 2.34 GW secured in the 2020/2021 auction. While increased participation from price-taking participants would shift the supply curve to the right (thereby reducing prices), our analysis suggests that excluding new interconnectors from the auction (and holding everything else constant) would have resulted in an auction clearing price only slightly higher at around £10/kW.
Bidding behaviour
Perhaps the most interesting difference from last year’s auction is the shape of exit bids around the target capacity. The graph below plots the supply curve of the 2020/2021 and 2021/2022 auctions as determined by the exit bids of market participants.4 As shown, at around a cumulative capacity of between 50 GW and 52 GW, market participants seemed to be willing to accept much lower prices than at last year’s auction. Although this change may reflect a shift in the supply curve due to new price-taking interconnectors and a decrease in the target demand, the shape of the curve also seems to suggest a change in bidding behaviour. Assuming that the cost of new entry and the going-forward costs of existing capacity has not changed significantly from last year, such a decrease in the revenues required from the capacity market may reflect the expectation of higher revenues elsewhere.
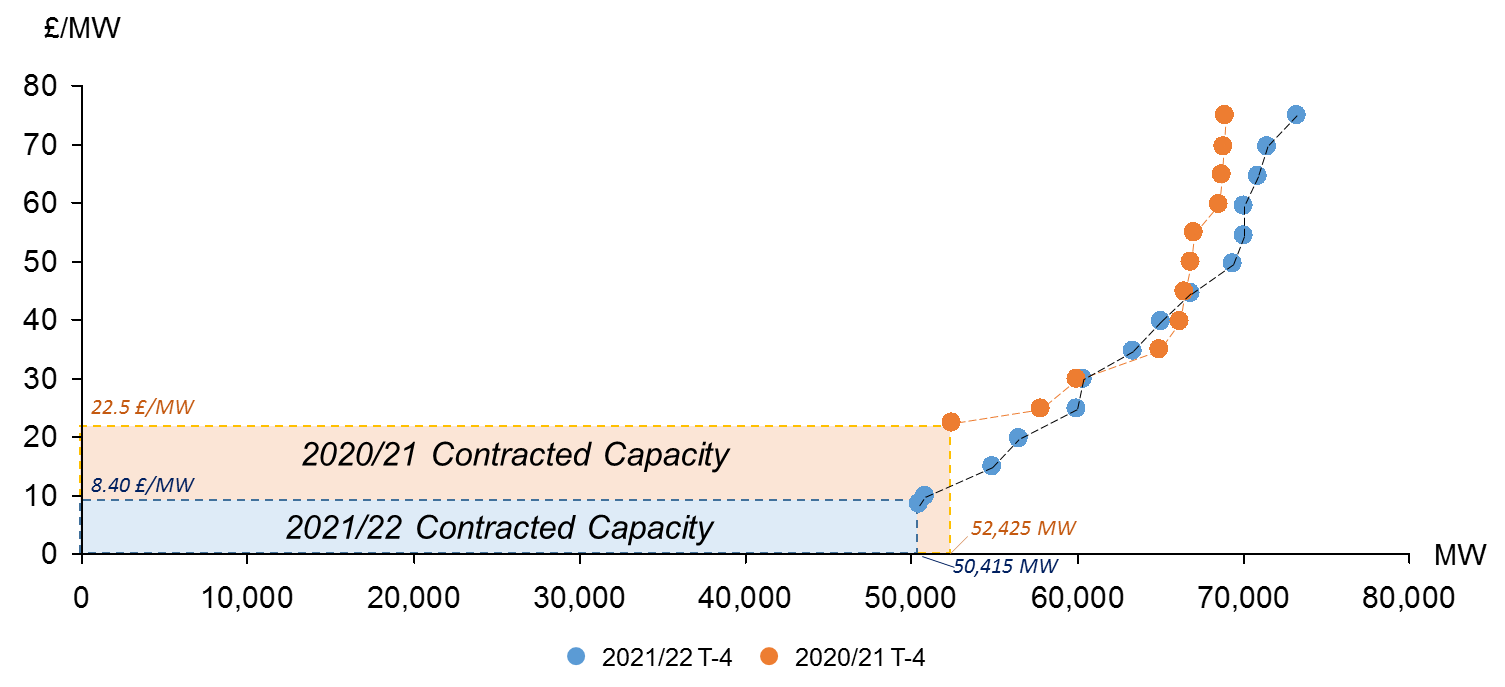
Figure 2: Auction supply curves for 2010/21 and 2011/22 T-4 auction
Given that changes in forward energy market revenues and spreads do not seem to justify such a significant change in bidding behaviour, what we see might reflect the expectation that changes to cash-out (increasing VOLL from £3,000 to £6,000) and the re-vamp to National Grid’s balancing services will unlock additional value for flexibility, thereby reducing the need for capacity remuneration.
Although there is a lot of uncertainty around how these markets will develop, shifting remuneration from the capacity market to more direct and frequently competed-for mechanisms like cash-out or balancing services is a positive development in the efficient functioning of the GB power market. The results of the capacity market auction may be an indication that a lot is riding on transparent and functioning cash-out prices and balancing services contracts.
1 Including Existing Generating CMU, Existing Interconnector CMU and Refurbishing Generating CMU
2 Source: EMR Delivery Body
3 New Interconnectors can benefit from a “cap and floor” regime, which reduces their level of merchant exposure. This is suggested to provide an unfair advantage with generation that is fully exposed to merchant risk.
4 These curves can be found in the Auction Results published by National Grid following each T-4 auction.
*/