*/
Europe saw a record number of offshore wind projects in 2017.1 The offshore wind industry is expected to continue to grow, driven by a combination of an extraordinary low cost of capital, continuous improvements in technology and falling construction costs. However, uncertainties around cost of capital, the impact of technological innovation and a tight labour market may create challenges. In this Insights, CRA consultants analyse these factors in the context of current market conditions and assess the potential implications for new offshore wind projects.
Rising cost of capital will put pressure on the economics of offshore wind
After a decade of declining cost of capital, interest rates are set to rise.2 Liquidity will be tighter and financing will be more expensive. Can developers count on a project to be bankable?
Monetary policies over the past decade have afforded developers favourable financing terms. Project gearing has increased from ~ 60% in 2007 to ~ 75% today. The debt margin has also tightened from LIBOR+3.5% in 2012 to LIBOR+2.0% today. As a result, a project today can raise debt at ~3.5%, 3 i.e. about half the rate in 2012. Together with the compressed equity internal rate of return (IRR), the offshore wind weighted average cost of capital (WACC) is now closer to 6% pre-tax nominal in mature markets.
Tighter monetary policies will increase the cost of capital.4 The swap market currently prices in a 0.5% increase to the interest rate by 2022. Tightening liquidity could lead to a higher debt margin and a higher equity IRR. A combination of a 0.5% hike in interest rates, a 0.5% increase in debt margin, based on the 2014–2015 lending market, and a 0.5% increase in the equity IRR would raise the WACC by ~1%.
Greater reliance on wholesale prices further increases the weighted average cost of capital. For example, recent subsidy-free offshore wind bids5 point to greater merchant-pricing risk exposure for future projects. To take on merchant pricing risks, investors will require a higher equity IRR, while lenders demand more restrictive lending terms,6 leading to a higher project WACC. However, the size of the impact is unclear.
Figure 1: Rising interest rates will increase project debt costs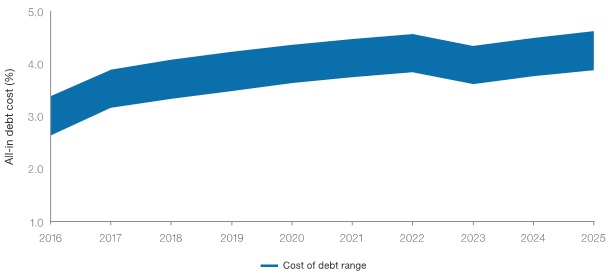
Source: Green Giraffe (2017), Offshore wind finance – evolution and outlook and Bloomberg 15Y EURIBOR three-month swap rate as of October 2018
For a project to break even, a 1% increase in project WACC will require wholesale prices to rise by 7%. CRA’s illustrative analysis (Figure 2) shows that the breakeven wholesale price for offshore wind would rise by approximately 7% for each 1% increase in project WACC. This would put pressure on projects which have not yet achieved final investment decision (FID) to increase revenues (or cut costs) by the same amount.
Figure 2: Higher WACC requires higher wholesale prices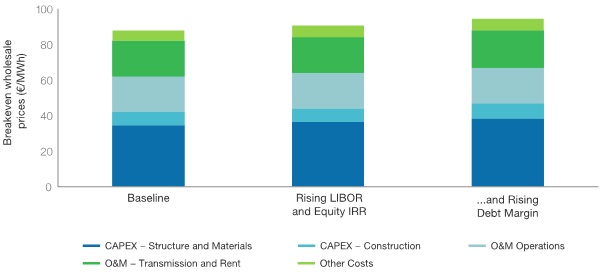
Source: CRA analysis of KIC InnoEnergy (2017), Future renewable energy costs: Offshore wind
Technological offsets— increase in turbine size
Technological improvements could offset the impact of rising project WACC. CRA’s analysis, based on KIC InnoEnergy data (Figure 3), suggests that there is potential for further capex reductions for offshore wind farms. Compared to an 8 MW turbine available today, a 10 MW turbine, which is expected to be available by 2020, would reduce the breakeven price by ~ 10%. A 12 MW turbine, expected to be available by 2025, would reduce the breakeven price by ~ 16% relative to the 8 MW model.
According to KIC InnoEnergy analysis, the increase in turbine size alone, from 8 MW to 12 MW, accounts for approximately half of the expected cost reduction for offshore wind farm projects. While 10 MW models are now available, 12 MW models remain speculative. In September, MHI Vestas Offshore Wind A/S announced the first commercially available 10 MW wind turbine for commercial installation in 2021. A 10 MW future, along with projects with FID by 2020, seems secured. However, projects with FID beyond 2020 may be more exposed to cost of capital risks and technology risks.
The concentrated turbine industry could slow the decline in turbine costs. In 2017, the two largest wind turbine manufacturers (Siemens Gamesa Renewable Energy and MHI Vestas) accounted for more than 75%7 of total installed offshore wind capacity in Europe. Further consolidation among wind turbine manufacturers could lead to upward pressure on turbine costs.
Figure 3: Technological improvements could bring down costs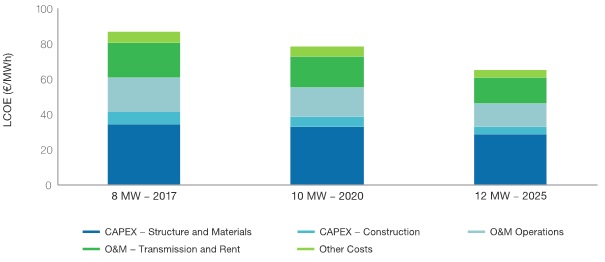
Source: CRA analysis of KIC InnoEnergy (2017), Future renewable energy costs: Offshore wind
Figure 4: Increasing turbine size plays a key role in reducing costs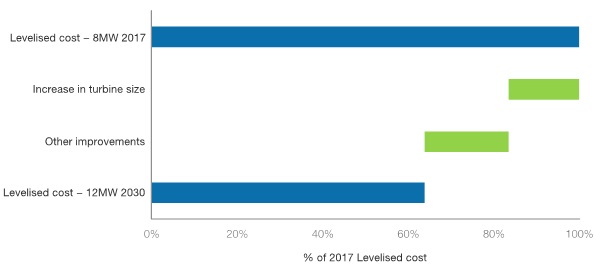
Source: KIC InnoEnergy (2017), Future renewable energy costs: Offshore wind
Ramping up new capacity may put pressure on construction costs
Forecasts for EU offshore wind capacity suggests aggressive installations over the next five years. The European Network of Transmission System Operators for Electricity (ENSOE) expects total EU offshore wind capacity to reach 45 GW by 2022, an increase of 30 GW from the 2017 level. See Figure 5. This requires approximately 6 GW of new installations each year to 2022, almost doubling the record 3.2 GW installed in 2017. It is unclear if the industry has sufficient resources to cope with this potential pace of installation. Rising oil and gas prices could put further pressure on installation capacity and lead to higher energy performance contract (EPC) prices.,9
Previous experience shows costs could rise sharply during periods of capacity constraints. According to the IHS Markit European Power Capital Costs Index (Figure 6), the costs of building coal, gas and wind plants peaked between 2006 and 2008, rising more than 20% before falling back during the financial crisis. That period was characterised by supply constraints within the turbine manufacturing industry, as well as shortages of installation vessels.10
A 15% increase in EPC contract prices would wipe out any cost savings due to increased turbine size and other improvements. Projects could be delayed or see a sharp escalation in costs. Some projects may have fixed commission deadlines due to, for example, having a long-stop date after which the subsidy contract could be terminated. Projects with fixed commission deadlines are more likely to be exposed to manufacturing and installation capacity risks, potentially leading to lower returns
Figure 5: Installations needed to reach expected capacity by 2022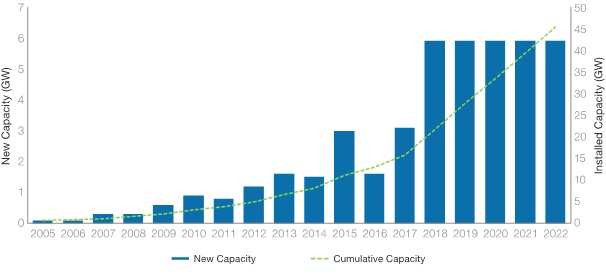
Source: WindEurope / ENTSOE
Figure 6: Previous experience suggests up to 20% cost increase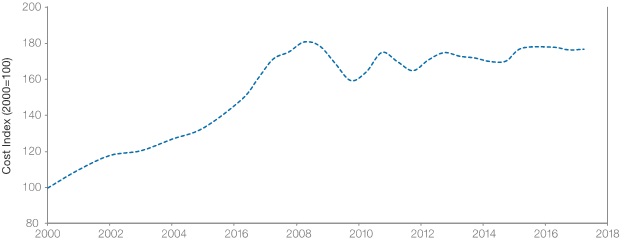
Source: IHS Markit European Power Capital Costs Index
Revenue opportunities beyond the wholesale electricity market
Market rules are changing to facilitate renewable participation in the market for ancillary services. European system operators and regulators are increasingly revisiting market rules for ancillary services. We highlight two recent examples in Germany and the Integrated Single Electricity Market (SEM) in Ireland where market rules have changed. Several studies have shown that the functionalities to provide these services already exist in wind farms but have yet to be exploited.11
In 2017, Bundesnetzagentur, the German regulator, introduced three changes to the secondary control reserve market to facilitate participation of renewable energy producers.12 It moved from weekly to daily auctions, which allows renewable producers to benefit from having more accurate wind and solar forecasts (daily vs weekly forecasts) when making bids; reduced the minimum bid size to below 5 MW, which allows smaller producers to participate; and implemented a four-hour delivery duration, which better suits intermittent renewable generation.
In 2016, the joint regulator for the single electricity market in Northern Ireland and Ireland (SEM committee) introduced changes to the system services market as part of its DS3 programme.13 The changes included an increase in tendered ancillary services from 7 to 14, with a cap on the payment from €55 million in 2015/16 to €235 million in 2020/21 and the classification of wind as a proven technology for the provision of fast-frequency response, primary operating reserve, secondary operating reserve and tertiary operating reserve.14 The proven technology classification allows wind generators to submit a tender to provide these system services.15
Capacity markets could bring some revenue stability in an environment of greater merchant pricing risk exposure. The UK currently prohibits subsidised wind farms from participating in the capacity market. With the trend towards a zero-subsidy, it might be possible to bid into the capacity market to generate capacity market revenues as is already possible in the US. This would increase revenue stability, attract more investors and lenders and reduce the project WACC.
With the opening of these markets to wind generators, investment decisions should be based on integrated modelling across wholesale, ancillary services and capacity markets to capture the maximum revenue potential and reduce revenue risks. A dialogue with lenders and investors will facilitate better understanding of new revenue opportunities.
The upshot: Implications for offshore wind
- A rapid increase in financing costs without a corresponding reduction in costs or increase in wholesale prices could cause difficulties in securing finance, particularly via the project finance route.
- Better risk modelling through more comprehensive scenario analysis and integrated modelling across multiple markets could help projects achieve better financing terms.
- With potentially rising costs putting pressure on returns, developers may choose to consolidate. This will provide the benefit of having a bigger balance sheet so developers can absorb risks and gain market share. Bids for new offshore sites are expected to remain competitive. With increasing costs, more revenue opportunities should be explored to supplement returns and increase revenue stability in a low-bid environment.
- The long-term prognosis for offshore wind costs remains favourable. However, uncertainties on the availability of larger wind turbines mean that investors should be comfortable with short-term fluctuations in cost trends.
- Greater reliance on wholesale revenues will lead to a higher cost of capital. Careful risk allocation across parties can reduce the cost of capital, but this has a cost in itself, so cost-benefit has to be carefully weighed up.
- See WindEurope, “Offshore Wind in Europe Key Trends and Statistics,” 2017, available at: https://windeurope.org/about-ind/statistics/offshore/european-offshore-w….
- See “Bank of England raises UK interest rates,” BBC, 2 August 2018, available at: https://www.bbc.co.uk/news/business-
45043776. - This includes 50 bps upfront fee and 15Y EURIBOR three-month swap rate only.
- See “ECB keeps policy unchanged, see QE ending this year,” Reuters, 26 July 2018, available at:https://uk.reuters.com/article/us-ecb-policy/ecb-keeps-policy-unchanged-….
- See “Dutch zero-sum win for Vattenfall,” reNEWS.biz, 19 March 2018, available at: https://renews.biz/32697/dutch-zero-sum-
win-for-vattenfall/. - See WindEurope, “Sustaining a cost-efficient energy transition in Europe,” 2018, available at: https://windeurope.org/wp-content/uploads/files/policy/position-papers/W….
- See supra note 1.
- See “Pieter Van Oord: Offshore Wind Faces Skilled Workforce Shortage,” OffshoreWIND.biz, 22 October 2018, available athttps://www.offshorewind.biz/2018/10/22/pieter-van-oord-offshore-wind-fa….
- SEA Europe, Market Forecast Report, 2018, p. 38, available at: https://maritimetechnology.nl/media/SEA-Europe-Market-
Forecast-Report-2018.pdf. - Global Wind Energy Council, Global Wind 2007 Report.
- Technical University of Denmark, Capabilities and costs for ancillary services provision by wind power plants, 2013.
- Andreas Franke, “Germany to tailor balancing market for renewables to participate,” S&P Global Platts, 29 June 2017, available at: https://www.spglobal.com/platts/en/market-insights/latest-news/electric-….
- Commission for Energy Regulation, Ireland, “DS3 – Ambitious approach to future network requirements,” 2017, available at: http://www.electricitystorage.co.uk/files/6314/8769/1905/11_presentation… 2017_MO_CLOONAN_002.pdf.
- EirGrid, DS3 System Services – Qualification Trials Process Outcomes and Learnings, 2017.
- Ibid.
The offshore wind industry has experienced significant growth of late and is expected to continue to grow, driven by the combination of a low cost of capital, technology improvements and decreasing construction costs. However, there are several challenges to overcome, including the uncertainties around cost of capital, impact of technological innovation and a tight labour market. CRA consultants recently conducted an analysis of these factors in the context of the current market and assessed the potential implications for new offshore wind projects.
Our analysis concludes that the long-term prognosis for offshore wind costs is a positive one. However, uncertainties on the availability of larger wind turbines mean investors should expect short-term fluctuations in cost trends. Download the full piece below.
–>