
Recent actions in the Middle East have disrupted the global flow of energy from key supply regions to consumers around the world.
Of the countries most impacted by these events is Qatar, with QatarEnergy having reduced shipments of liquefied natural gas (LNG) before declaring force majeure on deliveries under long-term agreements and suspending production of LNG at their major production facility, Ras Laffan.1
Key takeaways
- Global LNG supply disruptions are putting significant strain on international markets, although North America remains insulated (for now).
- Global buyers may expect the US to increase exports, but US liquefaction plants already operate at extremely high utilization.
- Longer-term price dynamics within the North American market are likely to be affected by global disruptions, as these issues could drive further development of LNG export capacity in conjunction with new demand to provide power to data centers.
As of March 18, 2026, it was reported that there was “extensive damage” at Ras Laffan, potentially impacting not only the shipping of LNG to customers, but also the fundamental supply-and-demand balance for LNG globally.2 Ras Laffan is a key supplier of LNG globally, representing an estimated 20% of globally traded LNG volumes.3 A reduction in supply from Ras Laffan could prompt global buyers to seek replacement cargoes to meet near-term demand within their given countries.
Impact on global gas markets
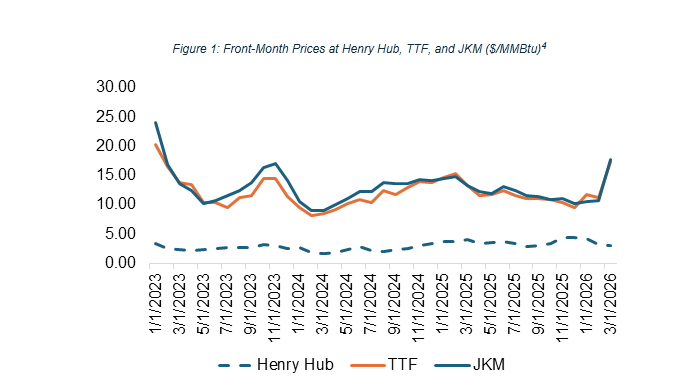
This has driven a sharp increase in gas prices at key global benchmarks such as TTF (in the Netherlands) and JKM (which reflects prices in East Asia). By contrast, Henry Hub in the United States has remained relatively steady around $3/MMBtu. Figure 1 shows how front-month gas prices at these hubs have responded to the market disruption in the Middle East.
Muted impact on North American market dynamics
This divergence has raised questions about the North American gas market and why Henry Hub volatility has been so muted relative to other benchmarks.
The North American gas market, which includes the US, Canada, and Mexico, generally operates as a self-reliant market that serves local demand and exports LNG to the global market. Said another way, the North American market does not receive material LNG imports to meet gas demand, except in limited situations. In fact, the US is the world’s largest LNG exporter.5
LNG exports from North America have expanded significantly over the past 10 years.6 This has changed market fundamentals within North America, as monthly demand for natural gas solely for export has grown from 0.5 billion cubic feet per day (Bcf/d) in 2016 to 15 Bcf/d in 2025.7 Explained another way, LNG exports have grown from roughly 1% of dry gas production in the US in 2016 to 14% in 2025 (see Figure 2).
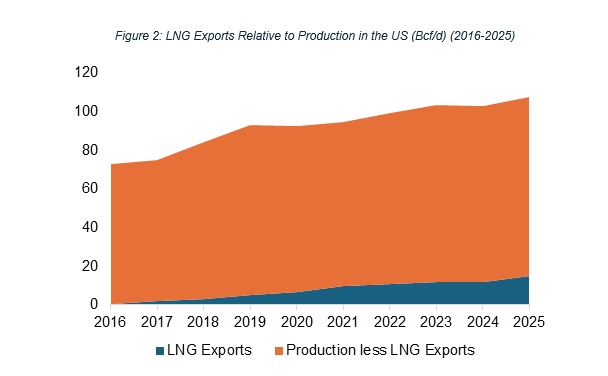
Over the same period, the US also saw rising demand from other sectors, notably the power sector and pipeline exports. However, LNG exports accounted for roughly 45% of total demand growth between 2016 and 2025.8
North American LNG export capacity and gas market fundamentals
Given the disruption to LNG supply from Qatar, one might deduce that US LNG could fill part of the supply gap and influence prices within the North American gas market. However, US LNG exports are constrained by available liquefaction capacity and the long-term commercial prospects for new LNG export facilities. Without additional export capacity coming online, it is unlikely US LNG will be able to close much of the short-term supply gap.
This has important implications for the North American gas market. Even as global buyers seek cargoes, the US is limited in how much additional demand it can serve in the near term without new liquefaction infrastructure. US LNG liquefaction facilities operate at high utilization rates – for example, in 2024, other than the newly commissioned Plaquemines LNG Phase 1, the other seven operating LNG export facilities averaged 104% of nominal capacity (86% of peak capacity) in 2024.9
Despite the disruption to the global LNG market, US prices have been comparatively stable. Until new export capacity comes online, US market fundamentals are likely to be driven primarily by demand in other sectors, including new demand for electric power from large data centers.
Since the 2022 Russian invasion of Ukraine drove large price increases in the European market, there has been significant enthusiasm for investment in LNG export capacity. This was especially true as the European market looked to meet demand that would have otherwise been served by Russian natural gas imported via pipeline. Leading up to the recent military activity in the Middle East, enthusiasm for new greenfield projects in the US had begun to wane as investors questioned whether projects could meet the financial and commercial thresholds required to reach a final investment decision.
However, if the situation in the Middle East evolves in a way that meaningfully constrains global LNG supply chains, developers in the US could face a different commercial environment as customers around the world look to secure additional LNG cargoes and long-term off-take agreements to meet demand.
While the opportunity to develop new liquefaction capacity could materialize, commercial decision-making must be evaluated in the context of a new competitive landscape for natural gas. Competition for gas within the North American market might fundamentally affect US gas prices and, ultimately, the competitiveness of US LNG.
Notably, while demand for feed gas to export from the US has increased by roughly 14.5 Bcf/d over the last 10 years, CRA estimates that natural gas demand from new data centers alone could grow as much as ~13 Bcf/d over the next five years.10 Combining this demand with the incremental ~15 Bcf/d of new LNG export capacity that is either under construction or undergoing commissioning in the US market, the US alone could face an incremental ~28 Bcf/d of new demand for natural gas by 2032.11 This new incremental demand would represent ~25% of total dry gas production in the market today before considering any new LNG export capacity being developed in Canada or Mexico, potentially leading to a fundamentally transformed market landscape.
While the US gas market has been shielded from recent activity in the Middle East that has led to material increases in gas prices in Europe and Asia, the market faces its own challenges. As global activity is spurring demand for new LNG export capacity and new data centers are developed, the US market is poised for material growth. The dynamic nature of the North American market could lead to fundamentally higher prices in the US – consumers of natural gas must pay careful attention to market fundamentals and not necessarily take low-cost gas in the North American market as a given.
Sources
1 Reuters, March 2026, “Exclusive: Qatar shuts gas liquefaction, will take weeks to restart, sources say,” available from: https://www.reuters.com/business/energy/qatarenergy-declares-force-majeure-lng-shipments-2026-03-04/.
2 Financial Times, March 2026, “Iran inflicts ‘extensive damage’ on site of world’ largest LNG facility in Qatar,” available from: https://www.ft.com/content/e3814e6f-a1c9-4ad4-b449-c14064d58f42?syn-25a6b1a6=1 .
3 Baker Institute for Public Policy, May 2024, “Global Energy: Qatar’s LNG Expansion,” available from: https://www.bakerinstitute.org/research/global-energy-qatars-lng-expansion.
4 Bloomberg.
5 US EIA, February 2026, “Ten years after first Sabine Pass cargo, U.S. LNG exports are still on the rise,” available from: https://www.eia.gov/todayinenergy/detail.php?id=67224.
6 US EIA, February 2026, “Ten years after first Sabine Pass cargo, U.S. LNG exports are still on the rise,” available from: https://www.eia.gov/todayinenergy/detail.php?id=67224.
7 US EIA, February 2026, “Liquefied U.S. Natural Gas Exports,” available from: https://www.eia.gov/dnav/ng/hist/n9133us2m.htm.
8 CRA analysis of US EIA data.
9 US EIA, March 2025, “The United States remained the world’s largest liquefied natural gas exporter in 2024,” available from: https://www.eia.gov/todayinenergy/detail.php?id=64844.
10 CRA analysis.
11 US EIA, June 2025, “U.S. Liquefaction Capacity,” available from: https://www.eia.gov/naturalgas/importsexports/liquefactioncapacity/U.S.liquefactioncapacity.xlsx.