
Indicators of change
These indicators help us track how natural gas limitations are becoming the system’s key constraint.
|
Henry Hub forward curve: Whether future supply needs are being priced.
|
||
|
Volatility and regional basis spreads: Early signs of system stress.
|
||
|
Rig counts and drilling activity: Whether supply is responding.
|
||
|
Pipeline, storage, and generation FIDs: Whether capital is stepping in.
|
||
|
Utility IRPs and regulatory rulings: How trade-offs between short-term cost minimization and long-term system reliability are being resolved.
|
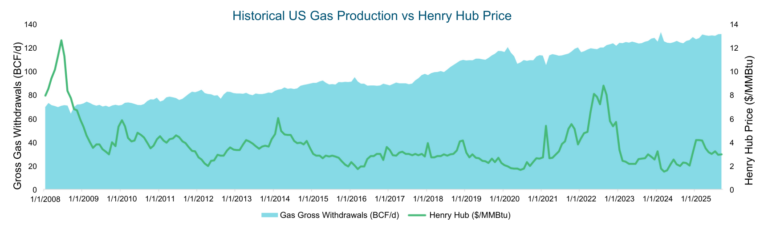
Shale fracking has driven sustained production growth
Development of shale plays has led to significantly increased natural gas production, while maintaining relatively stable pricing compared to the pre- 2009 period.
Low price environment continues: Aside from the post-pandemic price spike of 2021-2022, natural gas prices have generally been at or below $4/MMBtu for the past decade. However, sustained low prices may discourage new drilling and encourage a low-price environment.
Industry activity has contracted: Rig count has not recovered from the COVID-19 pandemic and resulting industry consolidation, with producing wells declining from over 900,000 pre-pandemic to over 750,000 in 2022 and over 520,000 in 2024.
The ability to close and open wells will be a critical driver in determining how quickly supply can increase to match demand.
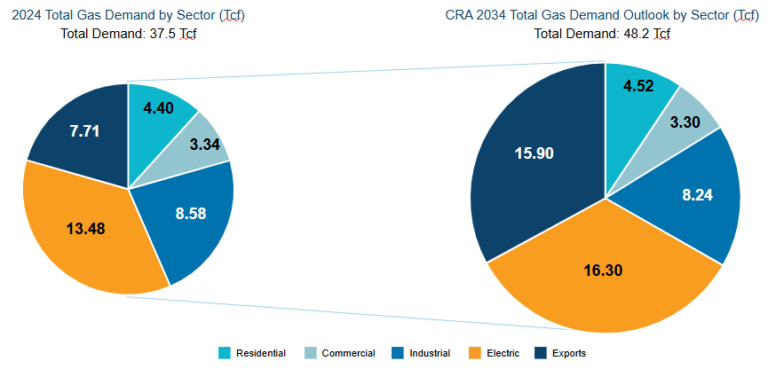
Natural gas demand is expected to surge by 2034
Total US domestic natural gas demand is projected to grow from ~37.5 Tcf in 2024 to ~48 Tcf by 2034 (~30%), with LNG export and electric sector demand serving as the primary contributors of the expected growth.
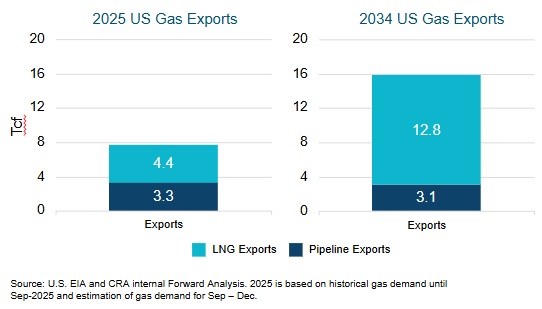
LNG growth globalizes US gas markets
LNG export growth represents a shift in US natural gas markets, with domestic supply now directly tied to global demand patterns.
Current demand is already stretching capacity: In 2024, existing US LNG export facilities operated at approximately 93% utilization; utilization levels are largely driven by growth in importing markets, with Europe (2.10 Tcf) and Asia (1.45 Tcf) accounting for the largest share of US LNG imports that year.
This high demand could drive large expansion: If similar utilization rates are maintained as new capacity comes online to meet growing demand, LNG exports could reach 12 Tcf by 2034.
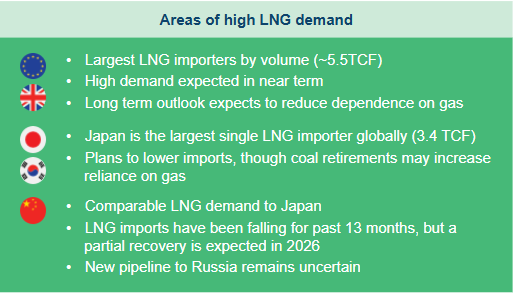
However, global uncertainties create planning challenges: The pace of the growth is highly uncertain, as India, China, and Japan have all reduced their LNG demand in the past couple years, and European supply-demand dynamics are influenced by geopolitical events and national emissions policies.
Power sector gas demand forecasts are up 45%
CRA’s electric-sector demand forecasts are up significantly compared to two years ago.
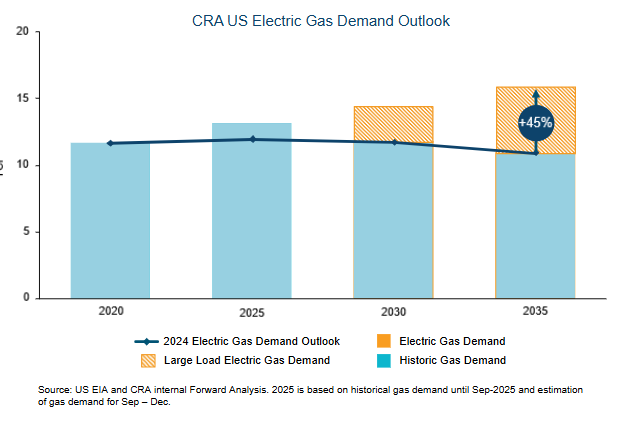
Power sector demand forecasts show significant growth across major regions:
- As per PJM’s 2026 load forecast, PJM expects the summer peak to grow by 66 GW (42%) by 2036 and by 97 GW (62%) by 2046.
- Georgia Power’s pipeline of large load projects totals 24 GW by 2029.
- ERCOT’s peak demand is forecasted to grow by ~40 GW (44%) by 2030.
Data center demand growth has the potential to significantly increase natural gas demand in the power sector by 2035, despite material growth in renewable penetration and energy efficiency gains.
Data centers prioritize firm, dispatchable, and scalable energy solutions to meet reliability, speed-to-market, and cost requirements amid grid and interconnection constraints.
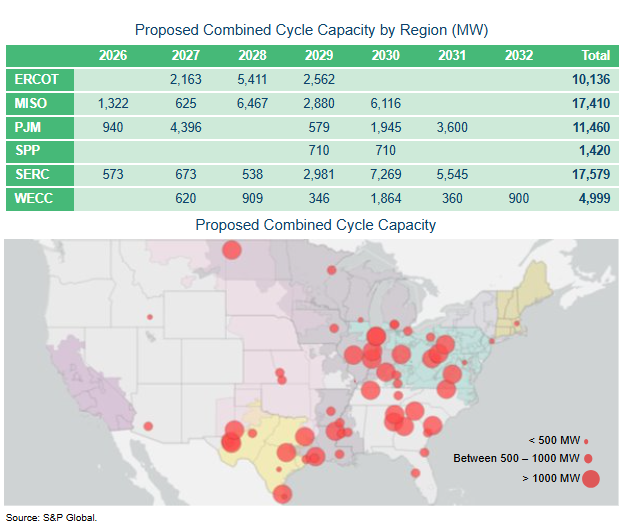
Natural gas build-out accelerates nationwide
Natural gas remains a primary generating resource that is dispatchable and scalable with existing technology, and the queue of combined-cycle projects has increased across every major power sector region.
“We’ve observed a clear shift in the US away from a pure “green agenda” toward a growing willingness in many regions to embrace natural gas. How permanent do you think this shift is?”
Respondents are split between medium-term pragmatism (37%) and long-term permanence of gas in the mix (37%), with 26% unsure, pointing to a durable role for natural gas while clean energy “competes on its merits.”
Forward prices don’t yet reflect demand growth outlook
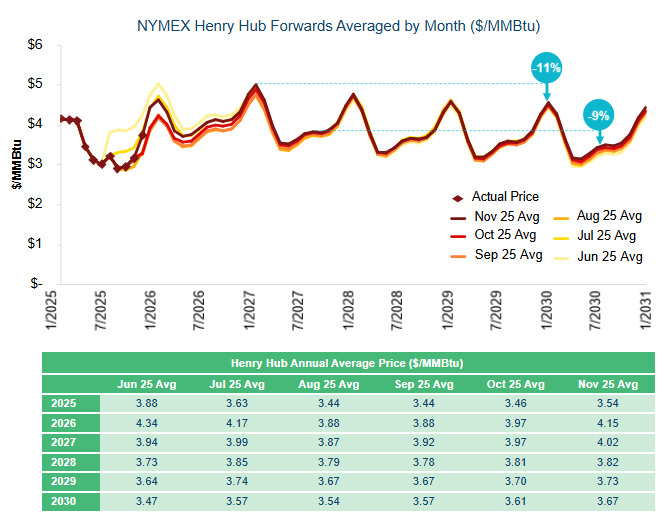
NYMEX forwards anticipate price declines after 2026.
- This either indicates that overall demand will decline, or
The cost of producing natural gas will go down
Underpriced forward prices could dampen the supply response, as new drilling requires durable, long-term economics to justify incremental rigs. If demand growth persists, forward prices would be expected to rise, with delayed investment increasing the risk of sharper price corrections as supply tightens. Something has to give.
Major uncertainties will require careful tracking from market participants:
- Declining reservoir quality and depletion can reduce well productivity over time (upward price pressure)
- Projected load growth may not fully materialize, reducing expected gas demand (downward price pressure)
- More stringent climate or regulatory policies, both domestically and internationally, could constrain long-term natural gas utilization (downward price pressure)
- Insufficient intrastate pipeline infrastructure in regions such as ISO-NE is impeding transport and increasing risk to demand fulfillment (regional upward price pressure)
How the natural gas system may rebalance
Forward price re-adjustment – Long-dated Henry Hub forwards rise when producers and their capital providers are unwilling to sell future gas at prices that do not justify drilling, reliability obligations, and infrastructure investment. As sellers pull back from locking in low- priced forward sales and buyers seek firm long-term supply, the forward curve adjusts upward. This is not a policy decision, but an emergent market response to misalignment between prices and the cost of reliable supply.
Increased price volatility – Price volatility rises when demand increases faster than supply can respond. With rig counts constrained and new supply slow to materialize, short-term markets absorb the imbalance through sharper price swings. Volatility becomes the mechanism that prices scarcity and reliability risk when long-term prices have not yet adjusted.
Contracting structures tighten (take-or-pay, firmness premiums) – Contracting terms tighten when sellers are unwilling to guarantee firm supply without stronger commitments. Pipelines, producers, and utilities respond to reliability risk by requiring longer tenors, take-or- pay provisions, or firmness premiums. Buyers accept these terms to secure certainty when spot markets alone cannot deliver reliability.
Higher required returns for infrastructure – Infrastructure investment slows unless capital providers are compensated for higher risk. When long-term prices are low and regulatory or market uncertainty is high, investors require higher returns before funding pipelines, storage, or generation. This raises the cost of infrastructure and limits expansion until returns are sufficient.
Load pays more for firmness – End users ultimately pay more when reliability becomes scarce. Large customers such as LNG exporters, power generators, and data centers face higher delivered gas costs, premium firm transportation, or the need to self-supply. Reliability shifts from being assumed to being explicitly priced and paid for by load.
Strategic implications for energy leaders
Natural gas demand is rising, and reliability expectations are increasing, but supply and infrastructure expand only with strong price and contracting signals. This disconnect complicates both affordability and reliability, leaving energy leaders to manage the tension between near-term affordability and long-term reliability through planning, contracting, and capital decisions.
Implications for utilities
– Reliability risk increases: Gas remains critical to resource adequacy as load growth outpaces firm capacity and transmission.
– Firm supply costs require as much attention as commodity costs: Greater emphasis on firm supply, longer tenors, and deliverability.
– Hedging strategies must adapt: More exposure to volatility and basis risk as supply response lags demand.
Implications for investors and independent power producers
– Fuel and deliverability risk directly affect project economics: Assets without firm gas or transport face greater downside during stress events.
– Capital becomes selective: Projects with weak contracting or exposure to congestion struggle to attract low-cost capital.
– Valuation depends on risk profile: Returns increasingly reflect risk allocation, not just market prices.